


 0 Comment
Guest post by Basil Zaidi, Co-Founder of Make Brands Big.
The question Campaign Manager cannot answer
You run an ad on Product A. A shopper clicks it, looks around your store, and buys Product B. Where does that sale show up? In Campaign Manager it shows up as a sale on Product A's campaign, because that is the ad that got the click. On your product-level ACOS, Product A looks great and Product B looks like it sells on its own. Neither is true. Product A paid for a sale it never made, and Product B is getting free traffic it will lose the day you pause Product A. Amazon calls these halo sales. Their share varies by account, which is why it is worth checking your own reports.
Most sellers never see this because the report that shows it, the Purchased Product report, sits in a corner of the ads console almost nobody opens, and when you do open it, it is a flat list of advertised ASIN against purchased ASIN with no totals, no grouping and no verdict. So we built the thing that reads it.
Why product-level ACOS lies on a multi-SKU account
Amazon books the spend against the product you advertised and the sale against whatever ended up in the cart. On a one-product account those are the same thing and ACOS is honest. On a catalogue of ten, fifty or three hundred ASINs they drift apart, and the drift always runs in the same direction.
| What the console shows | What actually happened |
|---|---|
| Product A: high ACOS, looks expensive | Its ads sold Product A plus three other listings. Count everything it sold and it is under break-even. |
| Product B: low ACOS, looks efficient | Half its sales came from clicks on other products’ ads. Its own ads are average. |
| Product C: no ads, strong organic | Some sales may be halo from Product A. Pausing A can put those sales at risk. |
The pause-on-ACOS trap is the expensive version of this. A PPC manager sorts by ACOS, pauses the worst five, and reports a cleaner account. Thirty days later total sales are down and nobody can say why, because the campaign that was feeding the catalogue was one of the five.
Fixing it does not need a new ad strategy. It needs the sale credited to the product that made it and the spend credited to the product that paid for it, side by side, for every advertised ASIN. That is one join between two reports. It is also a join nobody does by hand, because the halo report has no parent column and the Business Report has no spend.
What we built: the Account MRI
The Account MRI is a free scan that reads your Seller Central exports and follows every advertising dollar to the product that was actually bought. It runs entirely in your browser. Nothing is uploaded to us, nothing is saved, and when you close the tab it is gone. That is deliberate: we wanted ASGTG members to be able to run it on a live account without a conversation about data. It starts with one file, the Purchased Product report. Drop it in and you get the halo picture in a few seconds. Add the Business Report and Selling Economics and it adds margin, break-even ACOS and profit. Add the previous month and it tells you what changed. Ten uploads are possible; one is required.
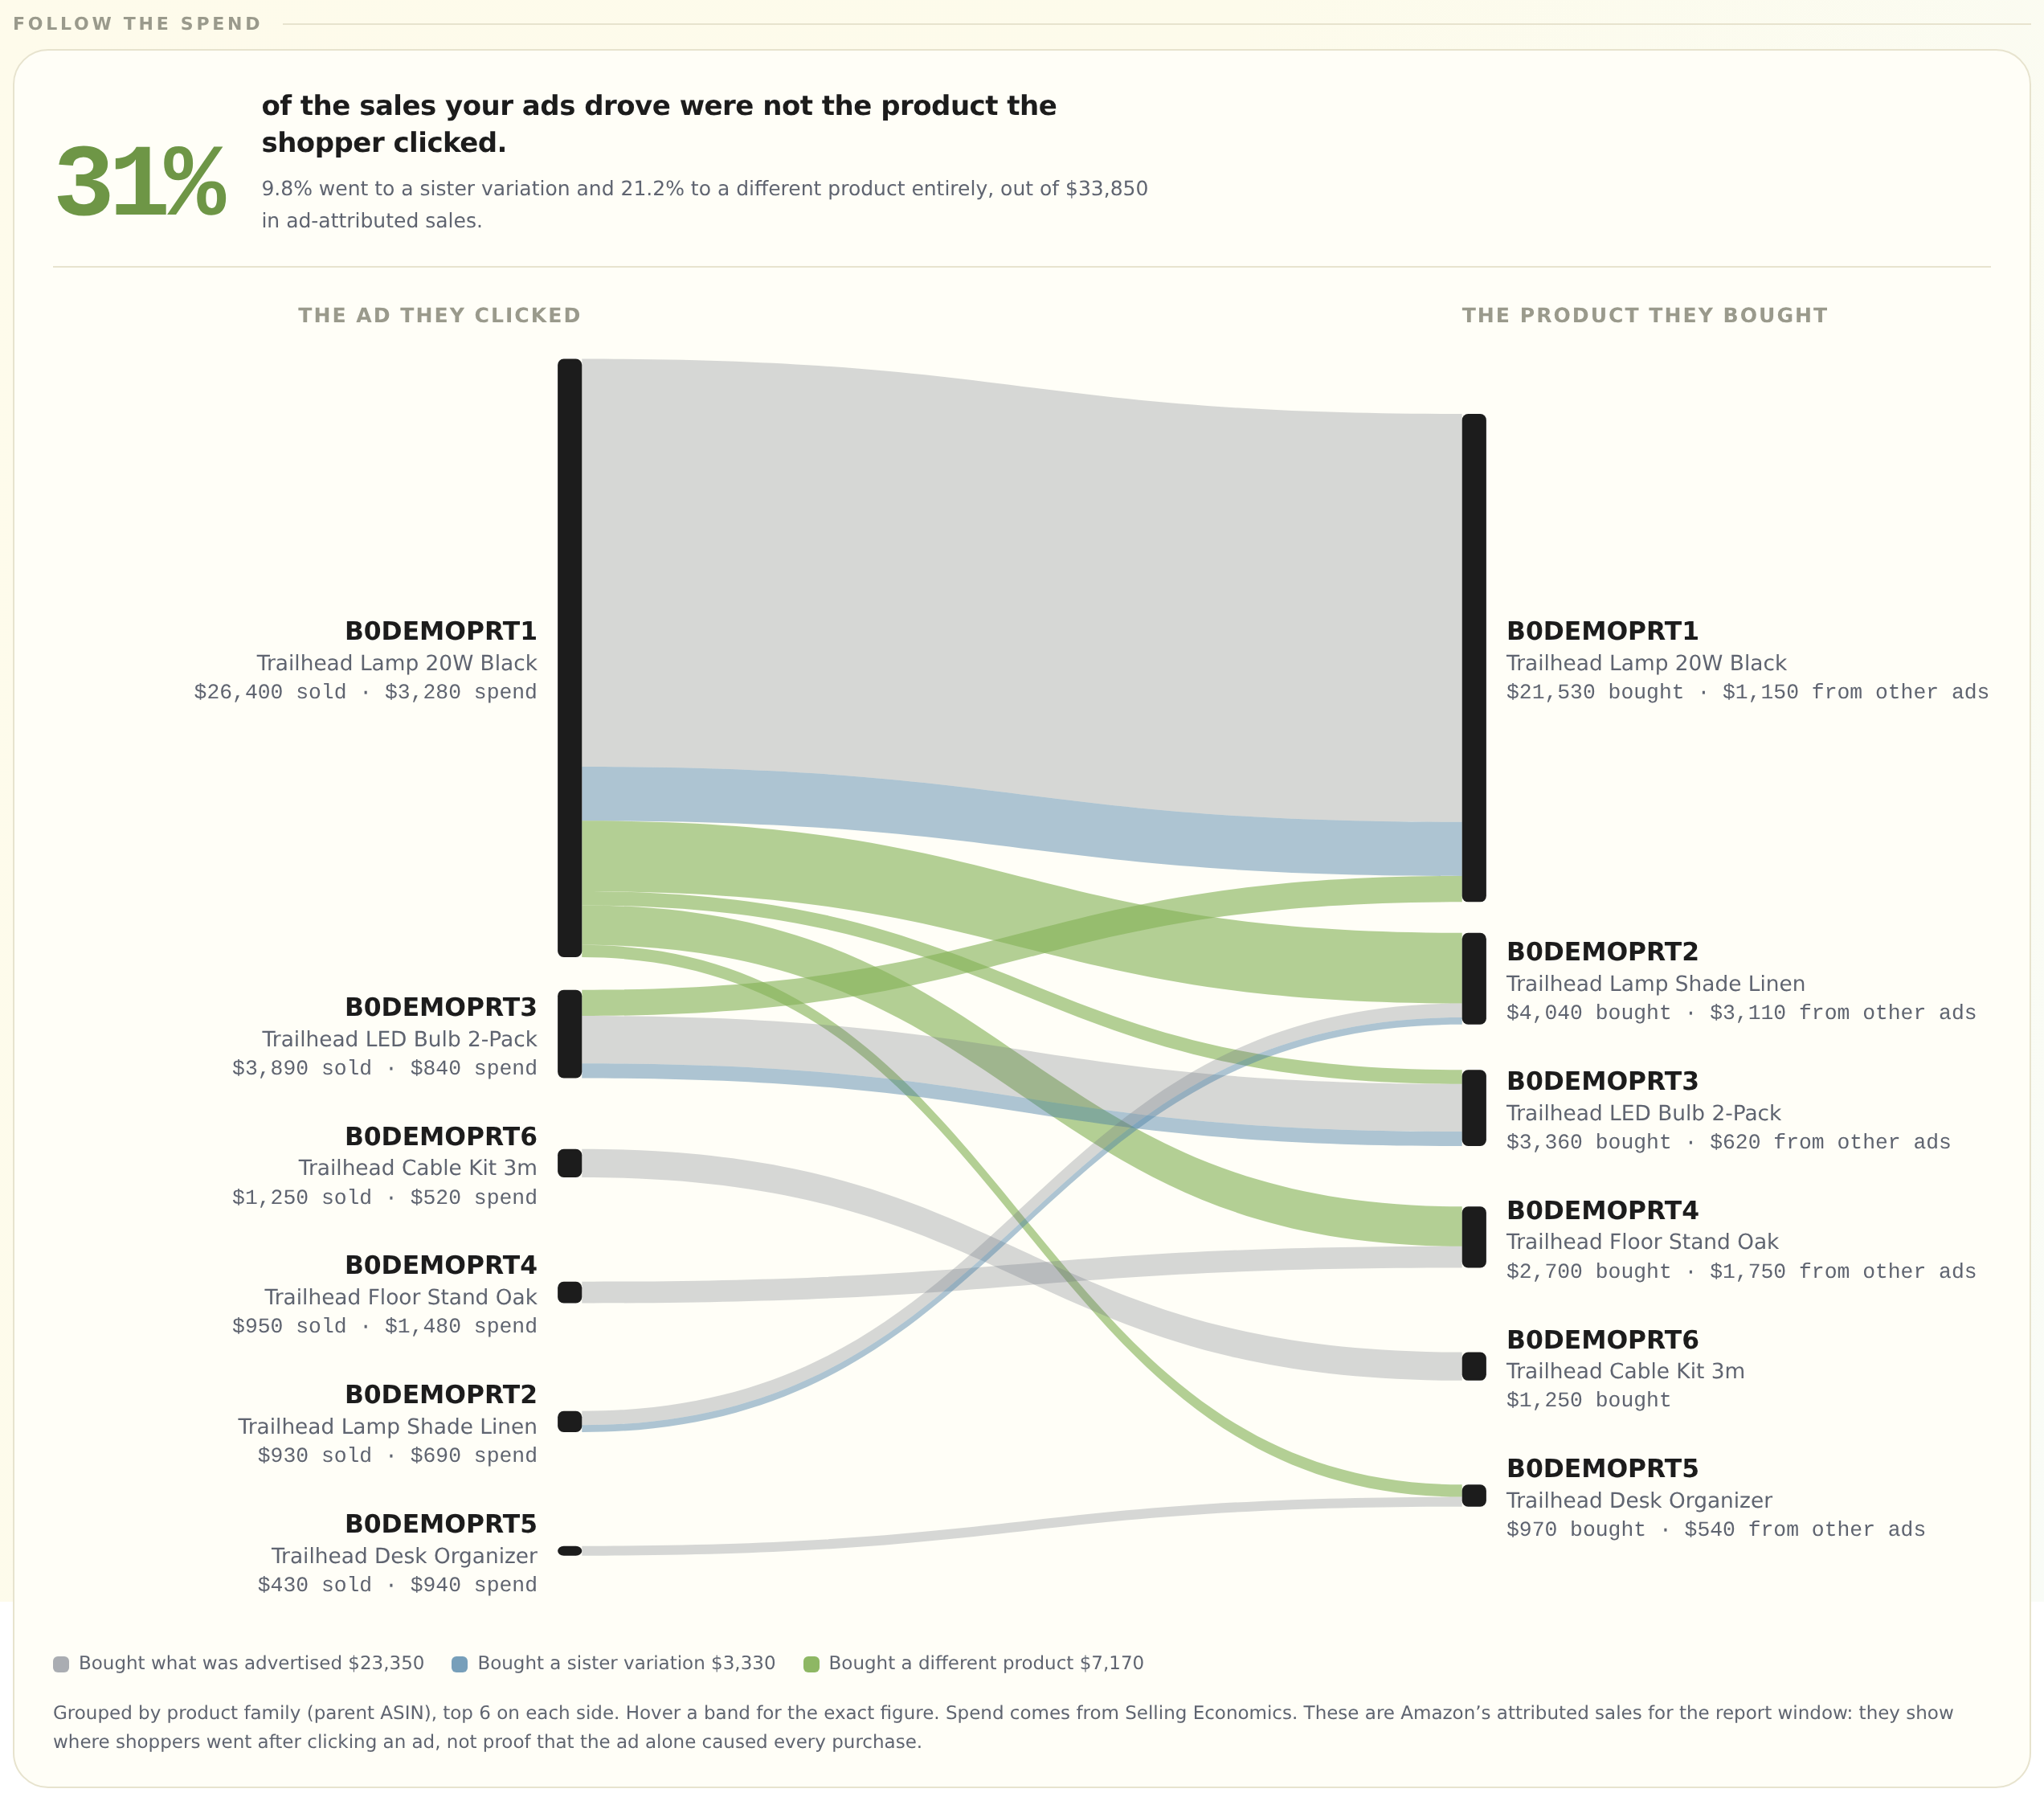
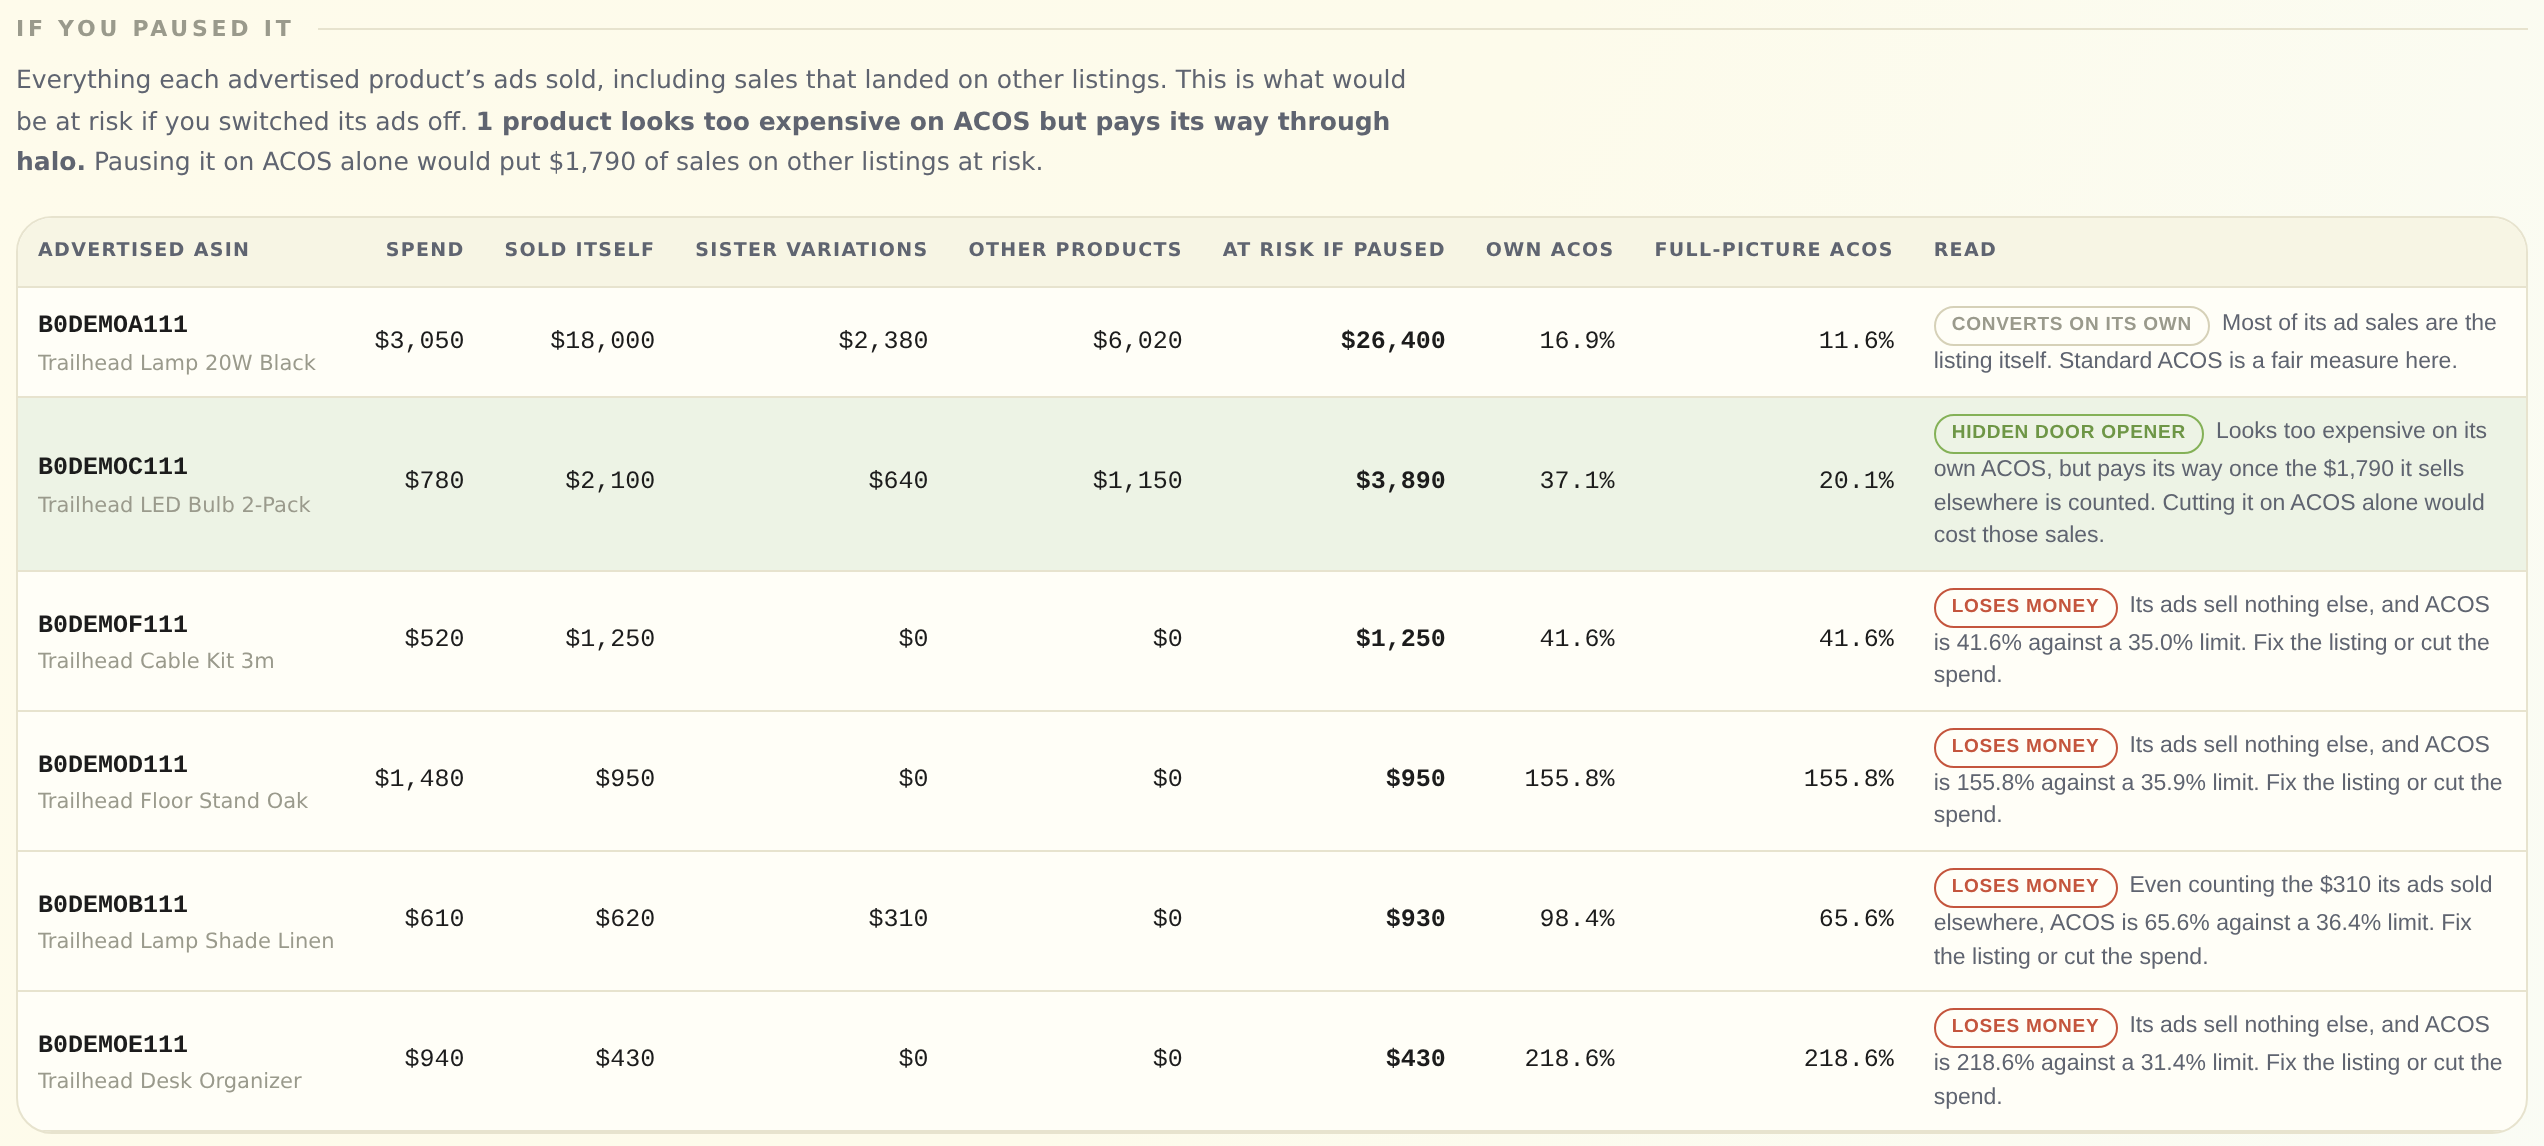
The first thing you see is a single sentence, in dollars: how much of your ad revenue landed on products you were not advertising, what share of ad sales that is, and how many products are earning traffic for the rest of the catalogue against how many are living off it. Underneath that is the map. Left side, the product whose ad was clicked. Right side, the product the shopper bought. Grey bands are shoppers who bought what was advertised. Blue is a sister variation. Green is a different product, the halo. Band width is money. Most sellers find their most important campaign in under a minute by following the widest green band to the left. Then the table that settles arguments: If you paused it. One row per advertised ASIN, with what its ads sold on itself, on sister variations, on other products, the total at risk if you switched it off, its own ACOS as the console shows it, and its full-picture ACOS once every sale it made is counted. Each row gets a plain-English verdict judged against that product's break-even ACOS from Selling Economics.
A worked example: the hidden door opener
The tool ships with a sample account so you can explore it before you download anything. The numbers below are from that sample, a ten-ASIN lighting catalogue, and they are typical of what we see on real accounts.
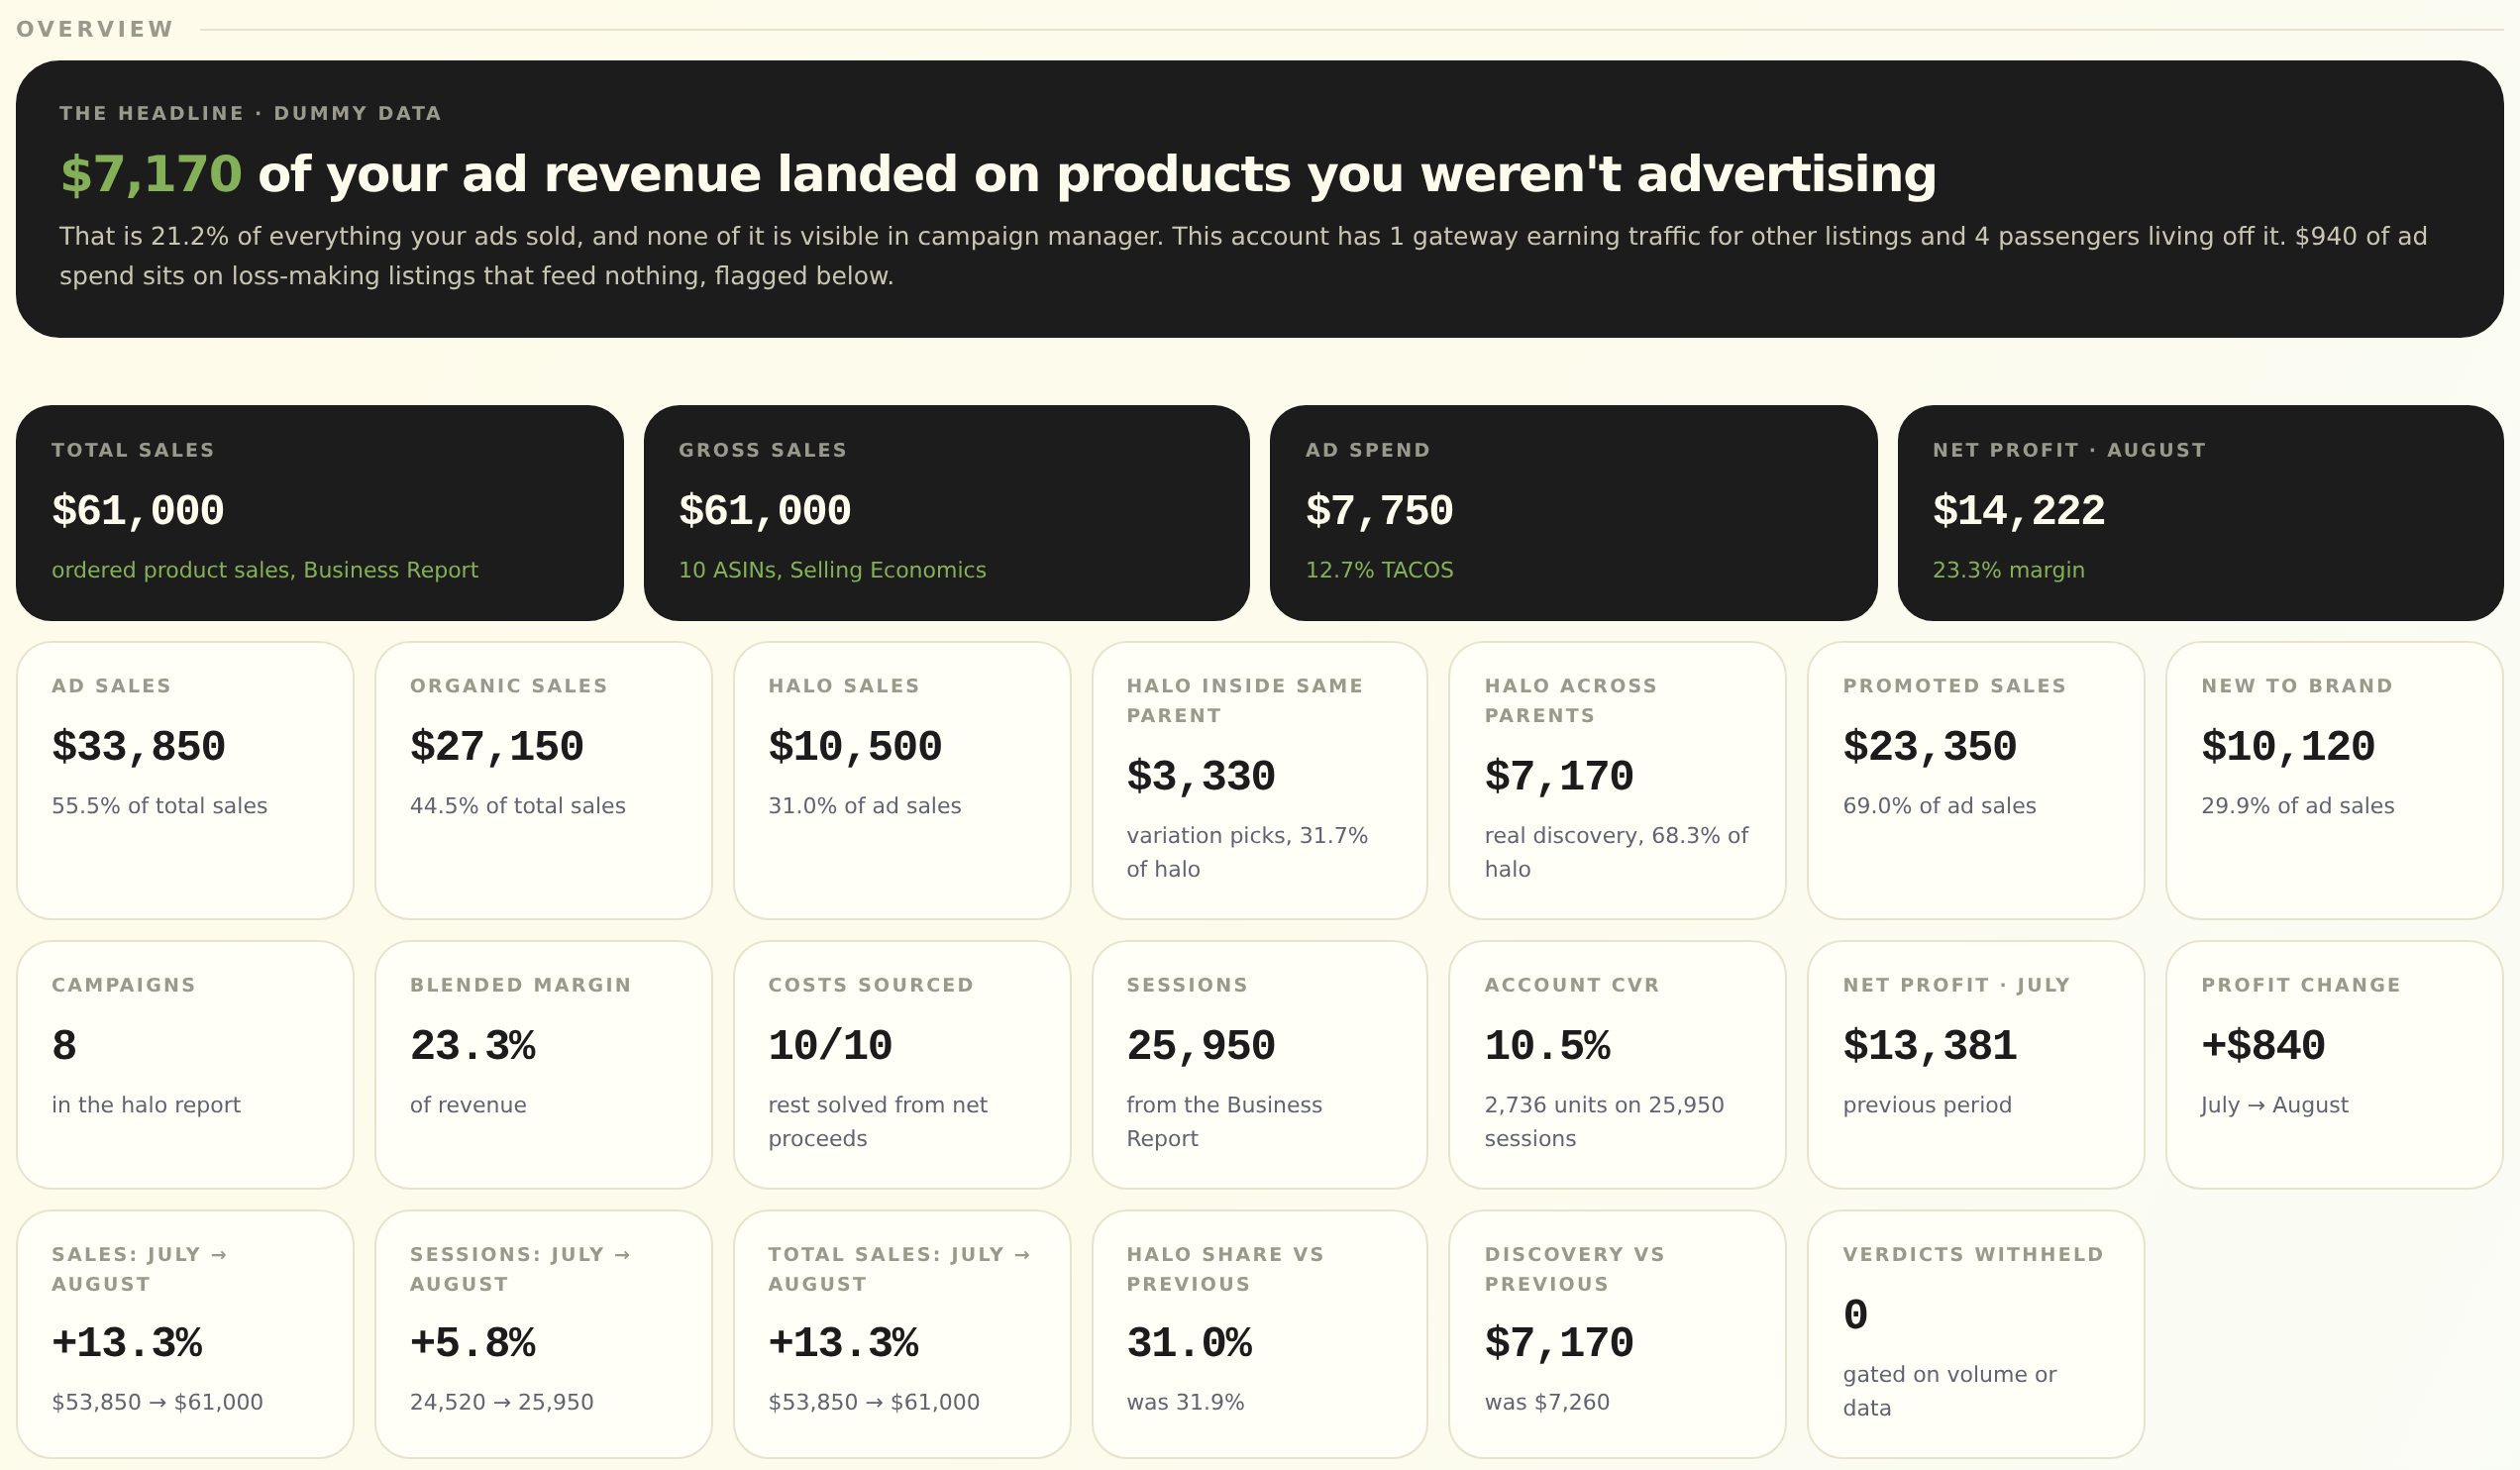
The sample does $61,000 a month, $33,850 of it ad-attributed. $10,500 of those ad sales landed on a product other than the one advertised. That is 31% of ad sales, invisible in Campaign Manager.
Now the pause table.
| Advertised product | Spend | Sold itself | Sold on other listings¹ | At risk if paused² | Own ACOS | Full-picture ACOS | Verdict |
|---|---|---|---|---|---|---|---|
| Lamp 20W Black | $3,050 | $18,000 | $8,400 | $26,400 | 16.9% | 11.6% | Converts on its own |
| LED Bulb 2-Pack | $780 | $2,100 | $1,790 | $3,890 | 37.1% | 20.1% | Hidden door opener |
| Floor Stand Oak | $1,480 | $950 | $0 | $950 | 155.8% | 155.8% | Loses money |
| Desk Organizer | $940 | $430 | $0 | $430 | 218.6% | 218.6% | Loses money |
¹ Includes sister variations and different products. ² Ad-attributed sales associated with the advertised product; this is not a prediction that every sale would disappear if ads stopped. All figures are sample data.
Read the second row. The LED Bulb 2-Pack shows 37.1% ACOS in the console against a 35% break-even. Judging it on that number alone could make it a candidate for pausing. But its ads also sold $1,790 of other products, mostly the lamp it fits into. Count those and its real ACOS is 20.1%, comfortably profitable. Pausing it would put $3,890 of associated ad-attributed sales at risk, including $1,790 on other listings. Attribution alone does not prove how much revenue would be lost. Now read the bottom two rows. Both look bad on ACOS, and both are bad, because their ads sell nothing else. Those are the campaigns to cut, and the $2,420 a month they burn is where the bulb's budget should have come from.
Same console, same account, opposite decisions. The only thing that changed is which product got credit for the sale.
What else the scan shows
The halo picture is the headline, but a full scan is 17 sections. Each one unlocks as you add the report it needs.
| Section | What it tells you | Needs |
|---|---|---|
| Overview | The headline verdict, plus total, organic, ad, halo and new-to-brand sales. | Halo report |
| Follow the spend | Flow map from ad clicked to product bought. | Halo report |
| If you paused it | At-risk sales, own versus full-picture ACOS, and a verdict per ASIN. | Halo report; Selling Economics for break-even |
| Creators and receivers | Which campaigns sell other products, and which products receive those sales. | Halo report with campaign name |
| Spend against profit | Ad spend against the profit each product makes. | Selling Economics |
| Where the money goes | Revenue split into Amazon fees, ads, cost of goods and what remains. | Selling Economics and COGS sheet |
| The board | Sales, spend, margin, break-even ACOS, TACOS and headroom per advertised ASIN. | All three core reports |
| What changed | Changes in sales, sessions, margin and roles against the previous month. | Previous-period reports |
| Search term audit | Wasted spend, n-gram root words and best keywords per product. | Search term report |
| Placement audit | Spend and ACOS by top of search, product pages and rest of search. | Placement report |
| The doctor’s desk | A ranked action list with the dollar reason for each action. | Everything you uploaded |
The doctor's desk is the part people screenshot. It will not give a verdict on a product with too little volume, and it says so, which matters more than it sounds. A tool that is confident about everything is a tool you stop trusting the first time it is wrong.
How to run it in 15 minutes
- In Seller Central go to Advertising, then Campaign Manager. In the left menu open Measurement and Reporting, then Reporting, then Create report.
- Pick Sponsored Products, report category Purchased product, time unit Summary. Set one marketplace and one full calendar month. Under columns, add Campaign name. Run it and download the CSV.
- Open the Account MRI, choose your marketplace, and drop the file in.
- Read the headline sentence, then the pause table. Look for any row where own ACOS is above your limit and full-picture ACOS is below it. That row is your hidden door opener.
- When you want margin and break-even on every row, add the Business Report by child item and the Selling Economics export for the same month. The tool tells you what each file unlocks as you add it.
UK sellers: the Selling Economics export is VAT-inclusive and the tool nets it out before any margin maths. US and Canada need no adjustment.
If you would rather watch it first, the five-minute version is my talk from Nick Penev's Amazon Hacks webinar in September, where it came third of seventeen in the audience vote: Follow the Spend.
Who this is for
Brand owners and private-label sellers with more than one product and real ad spend, say $5,000 a month and up. The more your products relate to each other, the bigger the halo and the more the console is misleading you. Accessories, consumables, sets, size and colour families, and anything with a "frequently bought together" row are the strongest cases. Resellers with a large catalogue get the same value from the money sections and the search term audit, and the halo picture tells you which of your listings are pulling shoppers into the rest of the store. If you sell one ASIN, skip it. There is no halo to follow and Campaign Manager is already telling you the truth.
Exclusive for ASGTG readers
The tool is free for everyone. Two things are for ASGTG readers only.
The Account MRI field guide. A 35-page PDF: which reports to pull and the seven clicks for the one that matters, with Seller Central screenshots. How to run the scan. All 17 sections with what each shows, how to read it and the one thing to look for first. What the five verdicts on the pause table mean before you touch a bid. And the five questions to ask your PPC manager every month.
A read-through of your scan with me. Run the MRI on your account, send me the PDF export, and we go through it together on a 20-minute call. I will tell you which rows I would act on first and which ones I would leave alone. No deck, no proposal. This is capped at the first 15 accounts because I do them myself.
How to redeem
- WhatsApp +1 307 400 8031 and mention ASGTG, or email info@makebrandsbig.com with the subject "ASGTG Account MRI".
- You get the field guide back the same day.
- If you want the read-through, attach your MRI export to the same message and we pick a time.
That is the whole flow. No forms, no gatekeeping.
About the author
Basil Zaidi is Co-Founder of Make Brands Big, where he runs the brand management and PPC side. He is an industrial engineer by training, which is why the agency treats an Amazon account as inputs, processes, outputs and meters rather than as a marketing problem. MBB has worked with 130+ brands, generated $50M+ in client revenue and keeps 90% of its clients year on year. The Account MRI is the free version of the first thing his team does on every new account.
Website: Make Brands Big · WhatsApp: +1 307 400 8031 · Email: info@makebrandsbig.com · LinkedIn: Basil Zaidi on LinkedIn
Comments